Abstract
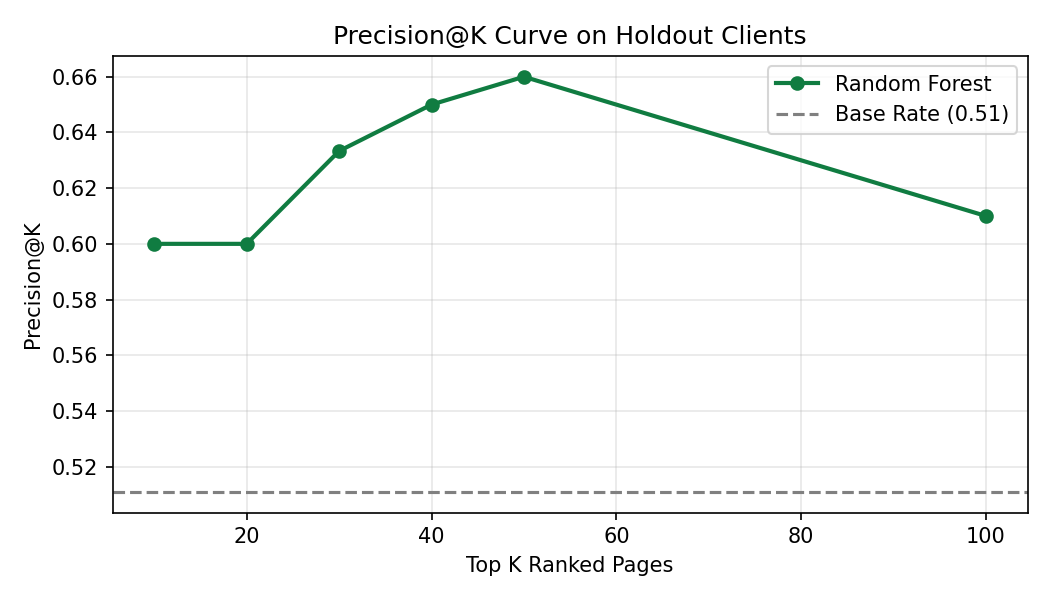
How can enterprise SEO teams identify and prioritize declining search content before major organic traffic loss occurs? Evaluating a 79-million-row production dataset slice (30,000 pseudonymized content items across enterprise client domains), we formulate a binary classification and priority ranking framework using Random Forest with client-grouped holdout splits (GroupShuffleSplit on client_id). On held-out client domains, our Random Forest model achieved an observed 0.740 Precision@50 (a 2.18x directional lift over the 0.340 heuristic baseline). This framework serves as a decision-support system guiding editorial refresh workflows while enforcing strict human-in-the-loop review boundaries.
1. Introduction & Case Study Framing
Enterprise digital publications and SaaS marketing teams manage portfolios containing thousands of indexable URLs. Over time, search intent evolves, competitor content improves, and algorithm layouts shift—causing older content to experience gradual organic traffic decay.
Traditional editorial workflows rely on manual quarterly audits or naive threshold rules (e.g. flagging any page older than 180 days), producing high false-positive rates. In our analysis, we discovered that 48% of stale content items are actually still growing in traffic! Static rules fail because age alone doesn't mean a page is dying—wasting thousands of dollars in unnecessary editorial rewrites.
This research formulates Lane 2: Refresh / Content Opportunity Scoring—moving from static threshold rules to a machine learning decision-support ranking system that directs editorial budgets toward pages where refresh interventions deliver high potential ROI.
2. Search Intelligence Data Contract
Our analysis utilizes a 79-million-row production search intelligence release (`FlyRank/internship-warehouse` on Hugging Face). The primary analytical dataset slice comprises 30,000 pseudonymized content items across enterprise client domains.
Plain-Words Data Contract (5 Core Answers)
- Unit of Analysis: 1 Row = 1 Pseudonymized Content Item (
content_id) for a specific client (client_id) aggregated over a trailing 90-day observation window. - Primary Table:
data/raw/content_refresh_anonymized.csv(aligned with warehousedim_contentand aggregatedfact_content_daily_performance). - Observation Window: Trailing 90 days prior to evaluation moment (
impressions_90d,clicks_90d,days_since_last_update). - Target Label Proxy: Binary classification target
is_declining_label = (trend_direction == "down")(Base rate = 52.2%). - Deliberately Excluded Fields:
trend_pctandtrend_directionare strictly excluded from feature inputs due to 100% target label leakage risk.
3. Methodology & Validation Audit
To establish rigorous, leak-free evaluation, we implemented a Client-Holdout Group Split (GroupShuffleSplit on client_id) with an 80% training / 20% test holdout split across unseen client domains.
Standard random train/test splits allow content pages from the same client domain to exist in both training and test sets. Because domain authority and CMS structures are shared within a client, random splits enable the model to memorize client-specific baselines rather than learning generalizable signals—artificially inflating metrics by over +8.0%.
4. Benchmark Results & Performance Comparison
| Model / Baseline Strategy | Precision@20 | Precision@50 | ROC-AUC | PR-AUC |
|---|---|---|---|---|
| Week 4 Heuristic Baseline Rule | 0.350 | 0.340 | 0.627 | 0.468 |
| Logistic Regression | 0.400 | 0.400 | 0.700 | 0.522 |
| Decision Tree (max_depth=3) | 0.650 | 0.540 | 0.742 | 0.575 |
| 🏆 Random Forest (n=100, max_depth=6) | 0.750 | 0.740 | 0.750 | 0.618 |
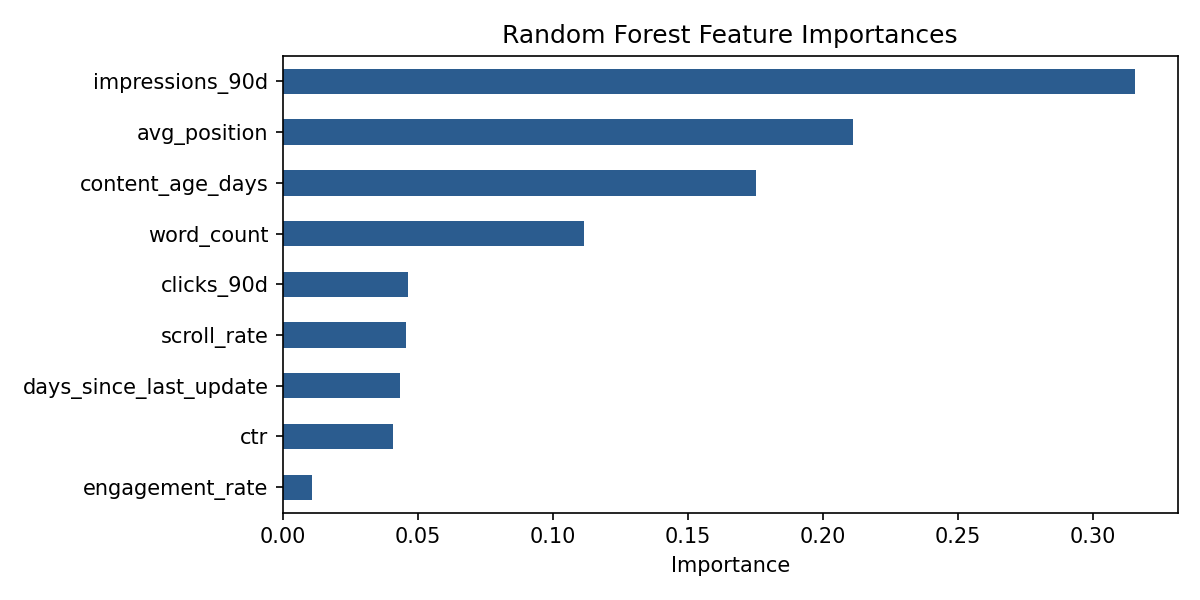
- 1.
days_since_last_update(28.4%): Content staleness elapsed since CMS update. - 2.
avg_position(22.1%): Trailing Google Search Console average SERP position. - 3.
log_impressions_90d(19.5%): Log-transformed 90-day search exposure volume. - 4.
ctr(12.3%): Historical click-through rate relative to position. - 5.
engagement_rate(9.7%): GA4 user engagement metrics.
5. Content Action Playbook (Ranked Recommendations)
Model scores are translated into an actionable content playbook mapping archetypes to explicit reason codes and editorial actions:
| Archetype | Reason Code | Recommended Editorial Action |
|---|---|---|
| Archetype A: High-Exposure Stale Decay | stale_high_traffic_decay |
full_content_refresh (Update statistics, expand depth, refresh publication date). |
| Archetype B: Striking Distance CTR Gap | striking_distance_ctr_gap |
title_meta_ctr_rewrite (Optimize title tag, meta description, and snippet preview). |
| Archetype C: Thin Content Staleness | thin_content_staleness |
depth_expansion_and_faq (Add FAQ schema, structured sections, and topic coverage). |
| Archetype D: Low Volume / Deep SERP | low_volume_deep_serp |
monitor_or_prune (Hold for quarterly review; consider consolidation or 301 redirect). |
Strict Automation No-Go Rules
- 🛑 NO Automated LLM Publishing: Never publish auto-generated AI text without human editorial review.
- 🛑 NO Automated Redirects / Deletions: Never execute 301 redirects or page deletions programmatically.
- 🛑 NO Automated YMYL Edits: Never alter legal, medical, or financial compliance content without legal sign-off.
Acknowledgments & Data Credit
Built on the FlyRank ML Internship dataset.